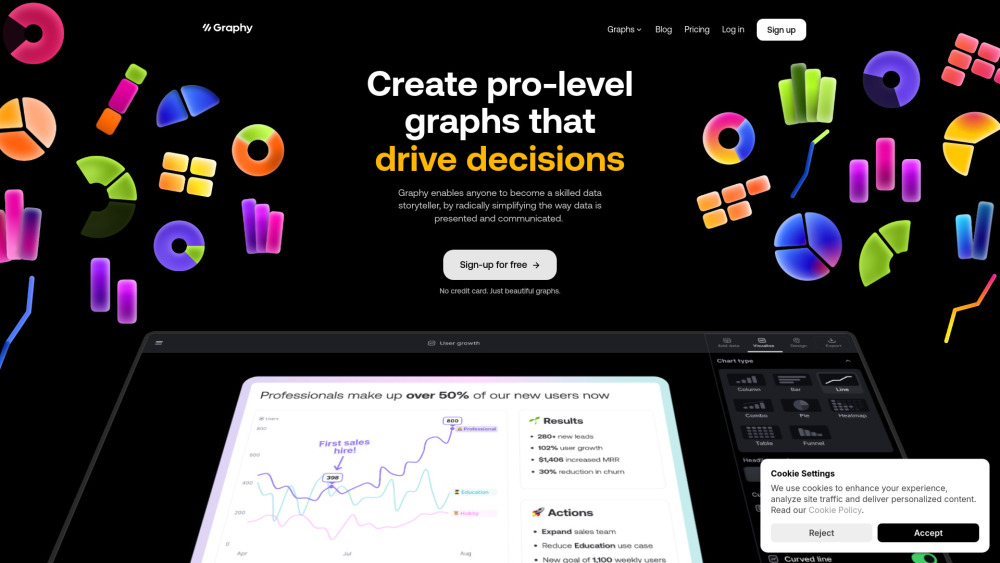
Graphy is a data visualization tool that simplifies the creation of professional graphs and charts, enabling users to communicate insights effectively and drive decisions with their data.
Graphyの使い方?
To use Graphy, sign up for free, connect your data sources, and utilize the intuitive interface to create beautiful, actionable graphs.
Graphyの使用例
Graphyの主な機能
Professional graph creation
Interactive data storytelling
Easy integration with data sources
AI-generated insights
Graphyのよくある質問
Is Graphy free to use?
What data sources can I connect to Graphy?